Seasonally adjusted unemployment rates for all Utah counties have been posted online here.
Each month, these rates are posted the Monday following the Unemployment Rate Update for Utah.
For more information about seasonally adjusted rates, read a DWS analysis here.
Next update scheduled for March 26th.
Showing posts with label Economist--Matt Schroeder. Show all posts
Showing posts with label Economist--Matt Schroeder. Show all posts
Monday, March 5, 2018
Monday, January 29, 2018
Ten Year Later:
Differing patterns of recession and recovery in the Wasatch Front North
December 2017 marked 10 years since the Great Recession
first cast its long shadow across the American economy. The recession
officially lasted 18 months, but its consequences can still be seen across the
country without having to look very hard. We have not had another recession
since.
Utah was hit hard at the time, losing a larger share of jobs
than the national average; but, we were fortunate to be one of the most
resilient states in terms of economic rebound. There are plenty of states where
the Great Recession continues to weigh upon them. Employment levels in 14
states are still not back to their pre-recession peak, and another 29 states
have only grown 5.0 percent or less. As the working-age population has grown by
more than 5.0 percent, the job gains nationally have not been enough to fully
employ working-age labor.
Utah lost 7.0 percent employment during the recession. Since
that low, employment has recovered by 18 percent. That is the second best
rebound in the nation. From Utah’s pre-recession employment peak to now, Utah’s
employment has increased by 9.5 percent, third best in the nation. Yet, Utah’s
job growth has not been enough to absorb all of the labor force growth during
that time. Utah’s unemployment rate is low, but the percent of the working-age
population in the labor force is several percentage points below the
pre-recession norm — telling us that potential labor is still not as fully
engaged with the job market as before the recession.
As a whole, Utah has had a notable recession rebound, but
those gains have not been shared equally across all regions. Just like the
national profile, some areas have bounced back strong while others are still
lagging behind. The state’s metropolitan areas have grown well, but many of
Utah’s rural areas cannot say the same. Nine counties have employment levels
below their pre-recession peaks.
In this issue of Local Insights, we profile Utah’s regional
and county economies in light of the 10-year span since the Great Recession.
Wasatch Front North
The Wasatch Front North (Davis, Morgan and Weber counties) is
often viewed as a single region. The reality is they each have distinct
economies and experienced differing recessionary impacts and recoveries. For
instance, Davis County is tied closely to Hill Air Force Base (AFB) and U.S.
defense spending. This helps to stabilize the region. Morgan County is a
growing bedroom community, but most new construction halted during the
recession. Weber County has a vibrant and diversifying economy, but lacks a
significant recession-resilient core to soften the severity of economic downturns.
Davis County
Davis County experienced a mild contraction during the
recession in comparison to Utah’s other counties, losing only 4,000 jobs and
falling by 3.6 percent. The downturn was short-lived, too. Davis County started
expanding again at the beginning of 2010, and regained its pre-recession
employment by late 2011; a time when most other counties were just turning the
corner and starting to rebound.
There is no single sector that dominates Davis County’s
economy, but Hill Air Force Base functions as the primary engine for economic
growth and stability — accounting for about 10 percent of total county
employment (around 12,000 civilian employees). During recessions demand falls
for many nonessential goods and services, but government defense spending is
historically stable. During the recession, Hill AFB employment dipped slightly
for a few quarters and then picked up helping to prop up the local economy.
Defense contracts bring steady jobs and the people filling
those jobs bring their families to live in the area. This adds to health care
services and education demand. Both provide recession-resilient jobs. The health
and education sectors combined continued to grow during the recession, and have
provided the single most consistent employment growth since the recession’s end
— adding more than 8,000 new jobs to Davis County since 2007.
Retail trade is the next largest industry in Davis County. In
most local economies retail growth follows the lead of other “core” industries,
primarily serving the local population demand. Due to its location along a
major commuting artery and its targeted growth strategies, Davis County has
developed a retail industry that serves a significant number of consumers from
outside the county that brings money into the local economy. Retail trade
employment is typically sensitive to economic downturns, but in Davis County it
only dipped slightly and then came back strong — averaging more than 3.0
percent growth since 2011, and even adding additional retail space in areas
such as Station Park in Farmington.
Thanks to its diversity and recession-resilient core, the
Davis County recovery has been steady and shared across many sectors. Current
employment now sits at about 124,000 — nearly 25 percent higher than its
pre-recession count. Growth at Hill AFB and the related IT, engineering and
manufacturing jobs it spawns boosts the local economy’s vibrancy. Professional,
technical and scientific services have been expanding employment at a rate of
about 4.7 percent annually on average since 2010, adding relatively high paying
jobs that will only help to further stabilize the region in the next cyclical
downturn.
Weber County
At the beginning of 2008, Weber County’s employment was nearly
97,000. By 2011 that number had dropped to around 90,000 — a more than 7.0
percent decrease. Drawdowns of both goods and service industries contributed to
the decline. Auto parts and aerospace manufacturing jobs dropped sharply with
large layoffs at Autoliv and Williams International, among others. Business and
employment services jobs sagged as well, especially among telemarketing
establishments and temporary work agencies. The construction sector shed some
3,000 jobs over the time period — in both residential and non-residential
construction. Nearly every sector was affected negatively, except for education
and health care services, which tend to be relatively resilient to economic
downturns.
Weber County’s recession resilient industries are not quite
large enough to act as a buoy when the rest of the economy is struggling. The
IRS is the county’s single largest employer, and those federal jobs tend to be
stable even through recessions. But it still only accounts for about 6.0
percent of total employment. Weber State University is a major stabilizing
employer in the region, as well — as are the local hospitals (McKay Dee and
Ogden Regional). Education and medical care tend to be recession hardy, but even
those employers combined still only make up about 7.0 percent of county total
employment. Their share of the economy was not large enough to absorb other large
job losses and counteract the fall in overall consumer demand. Granted, without
these stabilizing industries the recession might have been much worse for Weber
County.
The recession hit Weber County hard, but it did not stay
down long. By early 2011, the economy was on the upswing and has grown at an
average annual rate of about 3.0 percent since. The pre-recession employment
peak of 97,000 was regained by 2014, and now the county sits at about 105,000.
The rebound has been driven by some of the previously prominent industries as
well as some new players. For example, auto parts manufacturing has added back
all the jobs lost during the recession plus 500 more (largely at Autoliv).
Pharmaceutical manufacturing (primarily Fresenius in Ogden) has doubled its
share of county total employment since 2008, adding more than 600 jobs over
that time. In addition, business support and temp work agencies have returned
to pre-recession levels. But the really interesting county newcomer is
non-store retailing. Prior to the recession online retailers were virtually
nonexistent in Weber County — but the arrival of Wayfair in 2011 changed that.
There are now nearly 1,000 jobs in the industry.
The rise of these new industries suggests that Weber County’s economy is further
diversifying — a valuable element to help protect against future industry-specific
downturns. But diversity is not the only factor that mitigates recessionary
impacts. Large recession-resilient employers (like the IRS) act as stabilizers,
but the IRS has been downsizing (more than 1,000 jobs since 2011) which will
reduce Weber County’s recession-resilient core.
Morgan County
Morgan County lost about 300 jobs — or roughly 15 percent of
its 2008 employment during the last recession. Pre-recession peak employment
was nearly 2,000, and by 2012 that had dropped to almost 1,700. Construction
was hardest hit, shedding upwards of 180 jobs and accounting for the majority
of job losses. Morgan County has a large and growing share of residents that
commute outside the county for work. New residents moving in were driving
strong residential construction demand prior to the recession — 105 new
residential units were permitted in 2007. Once the housing crisis hit, demand
plummeted. In 2009, only 20 units were permitted.
Most other industries were relatively insulated from the
recession. Browning, a sporting equipment manufacturer and wholesaler, and the
largest employer in the region, was able to hold employment steady. Holcim, a
concrete manufacture and the second largest employer, did the same. These core
industries’ stability helped to mitigate constructions job-loss effects as local
demand remained consistent and health care, education and retail all weathered
the storm relatively well.
Morgan County turned the corner at the end of 2012, and has
been growing at an average annual rate of 5.0 percent since. New growth in
health care and retail are driving the recovery. New single-family home
construction is on the rise but has yet to return to pre-recession levels. By
2015 the county had recovered to its pre-recession peak and is now sitting at more
than 2,200 jobs.


Thursday, July 27, 2017
The New Retail Workforce:
How Online Sales are Changing Retail Jobs in Northern Utah.
Consumer spending makes up around 68 percent of the nation’s
gross domestic product. Consumer spending is individuals and families
purchasing groceries, clothing, recreation, stocks, insurance, education and
much more. The transactions cover a broad swath of economic activity.
Much of the nation’s consumer spending is captured via
retail trade. A useful retail trade definition is “the re-sale (sale without transformation) of new and used goods to the general public, for personal or household consumption or utilization.” Not all consumer spending is captured through retail trade transactions,
but a large share is.
Broad-category examples of retail trade sectors are motor
vehicle sales, furniture stores, electronic stores, building material stores,
grocery stores, pharmacies, gas stations, clothing stores and department
stores, among others.
Then there is the relatively new and emerging part of the
retail trade sphere — nonstore retailers. These are establishments that sell
products on the internet. Examples include Amazon, Zappos, Overstock.com, or
eBay. These types of retailers have grown rapidly in the past 15 years and
their presence is reshaping the retail trade landscape.
Whereas in the past nearly all retail transactions were done
through traditional brick-and-mortar stores, now a significant and growing
segment is diverted to internet sales. The consumer shops online and FedEx (or
like) delivers the product. One can see that the number of brick-and-mortar
stores and the level of local sales across the country are being endangered by
this economic evolution.
The brick-and-mortar reduction is beginning to show its
economic presence in the United States employment numbers. While the U.S.
economy is finally expanding at a healthy pace this side of the Great
Recession, one of the few industries not rising with this tide is retail trade.
While overall retail sales are increasing, employment is not.
Traditionally, as a population increases, retail trade
employment grows simultaneously, since population growth and consumer spending
volume is an integrated dynamic. If studied deeply, a certain ratio of retail
trade employment growth spawned from population growth would emerge. Before the
internet, the vast majority of all consumer sales occurred in the immediate
community or region. But now, the internet is diverting these sales away from
the local community — and with internet sales growing, its market share will
increase.
We do not yet know how much brick-and-mortar erosion will
eventually occur. And will such a phenomenon hit some areas more than others
(e.g., urban vs. rural, or local vs. tourist spending)? These are touch points
that economist will be watching as this internet sales phenomenon continues to
grow within the national and Utah economies.
In light of this change, in this quarter’s Local Insights we
are profiling retail trade employment throughout Utah’s local regions. This can
offer a profile of where retail trade is now in a local economy, and possibly
how much of the sector could become vulnerable to the internet-sales
phenomenon.
All regions can be viewed through the Local Insights
web
portal. The following is a retail trade profile for the Wasatch Front North
region:
Retail Matters in the Wasatch Front North
The retail trade industry is an important economic driver in
the Wasatch Front North. It employs nearly 28,000 people in the region — more
than 12 percent of total nonfarm employment. In Davis County, retail trade
employs a larger share than any other industry, and in Weber County it is the
third largest employer behind manufacturing and health care. Retail sales
account for some 57 percent of total taxable sales in the region — a
considerably larger share than the 52 percent statewide average.
The Rise of Online Retail
Due to consumers making more and more purchases online, the
demand for brick-and-mortar retail workers in the region has been softening.
Overall, employment in the Wasatch Front North has been growing at a rate of
about 3 percent on average since the end of the recession; but in traditional
retail, employment has been averaging just 1.7 percent. Prior to the recession
— and before online retail really took off — traditional retail employment was
clipping along at a much quicker average rate of 2.4 percent growth.
Non-store retail, on the other hand, has been booming in the
region. With the arrival and expansion of major online retailers, like Wayfair
in Ogden, employment in non-store retail has grown an average of 19 percent
annually since 2010. The share of total employment represented by non-store
retail has increased 137 percent over that time. The next highest employment
share expansion in retail was in the miscellaneous category (e.g., pet stores,
office supply stores, florists), which increased its share by a paltry 10
percent in comparison. Most other retail categories saw a decline in their
share of total employment.
Non-store Taxable Sales Are Gaining, But Not as Fast as
Employment. Why?
Taxable sales in non-store retail have not gained as a share
of total taxable sales as quickly as the employment share has increased. This
is primarily because sales taxes are collected by the state of the purchaser,
and then, only if the seller has a physical presence in that state. This means
that when Wayfair sells a rug to someone outside of Utah, there is money coming
into Utah (in terms of the jobs that the sale supports) but there is no sales
tax coming in to Utah. The only non-store sales taxes captured in Utah are Utah
consumers purchasing goods from retailers with a presence in Utah. Since a
large share of sales by local online retailers are to customers in other
states, it means that sales tax revenue lags compared to employment growth in
the industry.
An Aging Retail Workforce
Interestingly, the jobs in retail are not primarily younger
workers as one might expect. In fact, about 70 percent of the region’s retail
jobs are people 25 and older, and approximately 50 percent are at least 35.
There used to be more young workers in the industry. Prior to the recession in
2007, the share of 35 and older retail workers in the Wasatch Front North was just
40 percent.
During the Great Recession, the share of teenagers working
in retail plummeted from over 10 percent to about 5 percent and has remained
low ever since. The reduced youth base means there are fewer workers who stay
on and age into the older categories.
A Less Educated Retail Workforce
At the same time, the share of retail workers with less than
a high school education has increased significantly. This has been primarily at
the expense of individuals for whom educational attainment data are not
available (i.e., workers under the age of 24 — mostly students). Since 2007,
the share of workers with less than a high school education in Utah retail has
increased by more than 25 percent.
This does not appear to be an actual increase in less
educated workers. Rather, the drop in workers under 24-years-old is causing a
share increase for the existing less educated workers. As a result, the retail
workforce in the Wasatch Front North (and in Utah in general) is trending
toward an older and less educated demographic.
What is Driving This Trend?
Much of this trend is likely the result of young people
choosing to take jobs in other industries with better pay, as wages in retail
have suffered. Or they may be opting to finance their education rather than
work while attending school. But some portion of this shift is also being
driven by the structural changes taking place in retail due to increasing
online sales.
The Occupational Shift
The transition to non-store retail translates to shifting
demand for a different set of occupations required by non-store retail
operations. Traditional brick-and-mortar retail stores primarily need people to
work on the sales floor, such as retail sales workers and cashiers. Those two
occupations alone represent about 45 percent of all employees in traditional
retail. In non-store retail, on the other hand, the top two occupations are
customer service reps and shipping/receiving clerks. Freight and inventory
movers, order clerks/fillers, and truck drivers all play a much more prominent
role in non-store retail as well.
Generally speaking, these kinds of jobs tend to require more
time commitment than the most demanded traditional retail jobs. According to
the Conference Board’s Help Wanted Online® product (analyzes online job
postings), about 40 percent of job openings for cashiers and retail sales
workers (the top jobs for traditional retail) posted in Utah in the second
quarter of 2017 were part-time jobs. Only 20 percent of job postings for
customer service reps and shipping/receiving clerks (the top jobs for non-store
retail) were part-time. Positions that require more time commitment and more
fixed schedules are likely to be less attractive to young people — especially
students — who may be looking for opportunities that are less time consuming.
The Geographic Shift
In addition, there is a geographic component to this
transition. Traditional retailers tend to have many more locations spread out
geographically, making them more likely to have that cover a broader footprint
within the labor force. Online retailers, however, are generally centralized in
large warehouses, distribution centers, and office buildings that runs counter
to the disperse spread of traditional brick-and-mortar. As a result, it may be
harder for workers — especially younger workers — to get to and from these
jobs.
What It All Means
These structural changes are having a profound effect on the
retail workforce, and we can reasonably expect the resulting trends to continue
for some time. As new technologies and retail processes emerge, there will
doubtless be more shifts in this rapidly evolving sector. But for now, in the
Wasatch Front North region, we can expect fewer traditional brick-and-mortar
retail jobs, more non-store retail jobs, and an increasing share of retail
employment opportunities that may be challenging for our young population to
access.
Check Out the Viz
If you are interested in the details, the data visualization
below breaks out the various retail categories and allows you to compare sales
(as a share of total taxable sales) and employment (as a share of total nonfarm
employment) in each category (by county) over time. The relative changes in
taxable sales compared to employment are telling in relation to some of these
structural changes, although direct links are difficult to establish as there
are many other confounding factors. The tables at the bottom give the actual
sales and employment levels, summed-up for whatever you have selected in the
county and retail category filters.

Thursday, May 4, 2017
Census Bureau Tool Provides Labor-Force Insight for Wasatch Front North
Across the United States, jobs are quantified through each
state’s unemployment insurance program. Those programs provide the potential
for laid-off workers to receive unemployment benefits — the goal being to
bridge the gap between workers’ lost jobs and their next jobs. An eligible
recipient’s weekly benefit amount is based upon their earnings from recent
work. This begs the question, how does Utah’s unemployment insurance program
know how much an individual recently earned while working?
That answer is supplied by all businesses that hire workers,
as they must report their employees and pay as mandated by the unemployment
insurance laws. Companies identify their individual workers and those workers’
monetary earnings for a calendar quarter. As businesses are identified by their
industrial activity and geographic location, it is through the unemployment
insurance program that aggregate employment counts by industry and location are
calculated.
Yet each state’s profiling of individuals is quite minimal
in the unemployment insurance program. The U.S. Census Bureau can bring more
light to the overall labor force by supplementing said information with gender,
age, race/ethnicity and educational attainment (imputed from American
Community Survey responses) for Utah’s labor force.
The Census Bureau packages this information through their
Local Employment Dynamics program and makes available said data on its website. Here at the Department of Workforce
Services, we recently downloaded and packaged Utah-specific data from said
website and summarized it in the attached visualization.
Various data “tabs” are available, presenting Utah’s economy
from different angles, ranging from industry shares within the economy to the
age-group distributions of the labor force, to gender and race distributions.
These labor variables can be viewed for the state as a whole, or by each individual
county.
Some statewide highlights:
Industry — industrial distribution is quite diverse, which
provides strength within the economy. Distributions do fluctuate with time,
with manufacturing seeing its share lessen while health care and professional
and business services shares have increased.
Age — the bulk of Utah’s labor force is composed of 25- to
44-year-olds. Older worker shares have increased over the past 15 years, yet
still remain a non-dominant portion of Utah’s labor force. The youngest segments
of the labor force declined noticeably during the Great Recession due to less
participation, and that trend remains.
Educational Attainment — turnover rates are understandably
highest with workers under the age of 25 as they strive to build their educational
foundation and also find their niche in the labor market. A trend does stand
out where the more education that a worker attains, the lower the turnover rate
businesses experience from said educational classes.
Race/Ethnicity — Whites account for around 80 percent of
Utah’s labor force. The Asian community is small but slowly increasing in
share, and is also characterized with the lowest turnover rate and the highest
new-hire wages.
Gender — males comprise about 55 percent of Utah’s labor
force. The female share of 45 percent is higher than the national average.
Roughly 35 percent of working females work part-time compared to 15 percent for
males. Therefore, female new-hire wages are considerably lower than male
new-hire wages. (Note: employer reporting into the unemployment insurance
system is not hourly wage rate reporting but instead total calendar quarter
wages paid. Therefore, calculations can only be made upon total quarterly
wages, and part-time employment weakens this measure).
As for the various counties in the Wasatch Front North region,
here are some labor highlights:
Davis County –
Retail/wholesale trade industries dominate in Davis County
with more than 16 percent of employment. This share has been in decline,
however, since the end of the recession – not due to a decline in these industries,
rather, due to increased growth in professional and business services, which
includes management/scientific/technical consulting services. Alone, this
sector has added more than 1,000 jobs over the last 10 years.
In just the last two years, construction and manufacturing have
both begun to regain some of the share of employment lost after the recession. Non-residential
building construction in particular has added about 500 new jobs since 2013.
Weber County –
Perhaps surprisingly, Weber County has an even larger share
of employment in retail/wholesale trade than Davis County – nearly 17 percent
compared to 16 percent, but that is primarily due to the wholesale portion of
that sector which has a large grocery and related product merchant wholesaler employer
in the Ogden area.
Manufacturing and professional/business services both
compose large shares of Weber County employment, about 14 percent and 15
percent respectively. However, the health care/social services sector has been
increasing its share over the last 15 years more than any other sector. In 2000,
the sector’s share was about 9 percent and now it’s nearly 13 percent – a major
shift. In particular, over that time, the general medical and surgical hospitals
industry has added more than 2,000 new jobs, primarily driven by the new
McKay-Dee Hospital facilities and service expansions in Ogden in the early
2000s.
Morgan County –
In Morgan County, the largest share of employment is in the retail/wholesale
trade sector as well, at about 20 percent. Like Weber County, this is largely
due to the wholesale industry since Browning, the largest employer in the
county, is classified as a wholesaler.
Construction is the next largest sector, although it has
been trending toward a smaller share since the end of the recession. The number
of employed in construction has not changed much in the last 15 years,
averaging between 300 and 350 workers, but the health care/social assistance
sector has been growing quickly – from about 25 jobs in 2000 to more than 170
in 2016, thus edging out construction’s share of the pie. Residential care
facilities and ambulatory health service have been driving that growth.

Wednesday, October 19, 2016
Show Me the Economy - Occupational Projections for Utah's Wasatch Front North
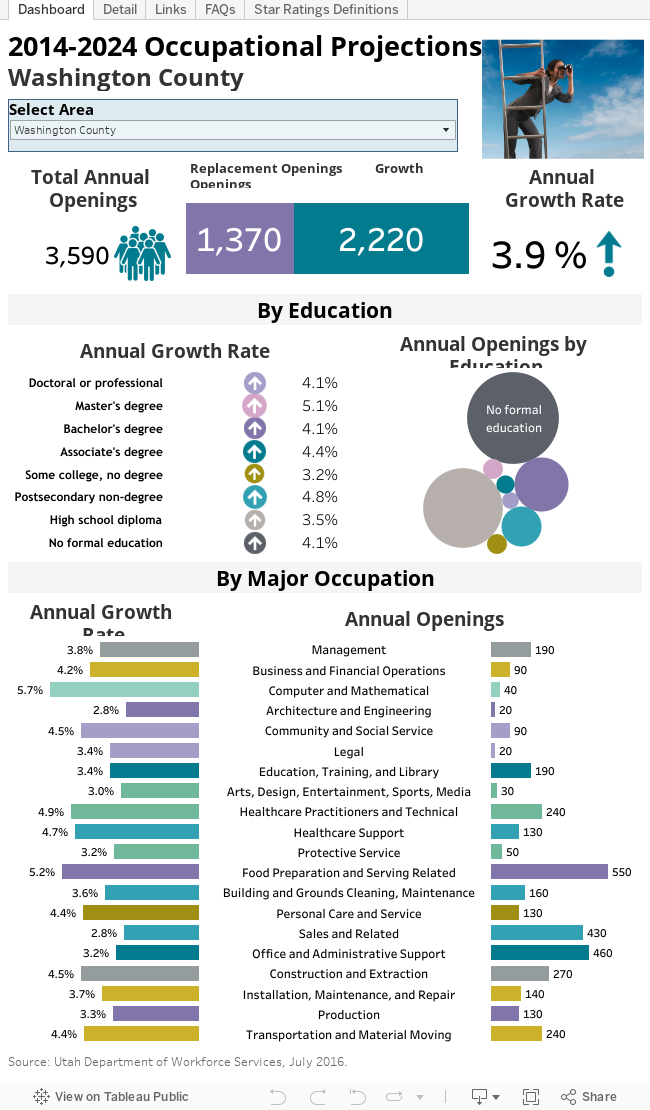 The biennial update to Utah's occupational projections have been released and can be found here: http://www.jobs.utah.gov/wi/pubs/outlooks/state/index.html. But first. check out these highlights:
Ogden-Clearfield MSA
Matt
Schroeder, Regional Economist
The
following are some general highlights gleaned from the Ogden-Clearfield Metropolitan
Statistical Area (MSA) occupational projections:
The
projected occupational growth rate in the Ogden-Clearfield MSA (which includes
Box Elder, Davis, Morgan and Weber counties) is similar to the rest of the
state on average at 2.6 percent annually through 2024. Utah statewide projected
growth is 2.7 percent. The 12,120 projected annual openings in Ogden-Clearfield
MSA from 2014 to 2024 represent about 17 percent of all projected openings in
the state.
The occupations
with the highest growth expectations are, on average, those that require the
most education. Jobs that typically require a doctoral or professional degree
are projected to grow 3.4 percent annually through 2024. Growth in openings for
postsecondary teachers of business, criminal justice and health specialties are
the primary drivers of this trend.
Occupational
expectations in construction and production (i.e., manufacturing) are
noteworthy in the Ogden-Clearfield region as well. Both of these categories are
already supplying large numbers of annual openings and are still expected to
grow at more than 3 percent every year. Jobs in these areas typically don’t
require as much education but offer relatively good wages. Electricians, for
instance, have a strong demand outlook. They typically require an
apprenticeship but no college education, and they earn a median wage in the region
of nearly $48K per year. Machinists, similarly, are expected to have plenty of
job opportunities through 2024, while requiring only some college or long-term
on-the-job training. In the Ogden-Clearfield region, they earn a median wage of
$52K per year.
Jobs in engineering
and information technology (IT) are also expected to continue growing at more
than 3 percent annually over the next eight years; and, together, are projected
to produce nearly 600 openings per year in the region. Jobs in engineering and
IT tend to offer high wages for the level of education required. Mechanical engineers,
for instance, are in high demand (about 70 openings per year in
Ogden-Clearfield). They typically require a bachelor’s degree and earn median
wages of $81K per year. Another example is applications software developers who
make median wages of $74K per year and have job opportunities projected to grow
at 3.5 percent annually (about 40 annual openings in Ogden-Clearfield).
There are
many other occupations in the region that are projected to offer excellent
opportunities as well — industrial machinery mechanics, dental hygienists,
industrial engineers, electronics engineers and computer systems analysts to
name just a few. You can learn more about these occupations and others through
the Utah Occupational
Explorer where you can explore and compare occupations of interest in
detail by region, wage level, typical education required, projected growth and
demand. Before digging into the details though, take a look at the interactive
data visualization above to see the big picture of the occupational outlook for
the Ogden-Clearfield MSA.
About Utah's Occupational Projections
About Utah's Occupational Projections
Mark Knold,
Supervising Economist
“The
government knows everything about everyone.”
Fortunately,
that statement is not true. Yet society still looks to the government to
provide answers to comprehensive and complex questions that have their
foundation within individual decisions and activities. One subject frequently
directed toward the government is individual-level information about the
economy — particularly, what occupations are in demand, what occupations pay well
and have lucrative outlooks, and ultimately, what occupation(s) should I build
my career upon?
It takes the
accumulation of a wide array of individual information to answer these
questions. Employers provide the foundation information about the occupations
they employ. Jobs are held by individuals, but employers provide the profile
information about the job itself, not any particular individual.
Since
society desires to profile such a broad spectrum of the economy — occupational
profiles and the occupational distribution within the economy — only government
is in the unique position to collect, analyze and provide answers for said
desire. Yet, no government program or regulatory agency mandates any
comprehensive occupational reporting from individuals or businesses. Therefore,
government attempts to fill the void with an ongoing, robust and voluntary
survey of employers — a survey where employers are asked to provide details
about their various occupations, including descriptions, quantities,
wages/salaries and location. Through this survey emerges an occupational
portrait of an economy.
The U.S.
Bureau of Labor Statistics (BLS) structures and funds the survey, yet the
individual states conduct the survey. Under BLS administration, all states use
the same methodology; therefore, occupational profiles are comparable across
states.
Through this
survey, analysts discover how industries are populated with various
occupations. Accountant is an occupation, yet accountants can be found across
many different industries. Other occupations may be more exclusive to certain
industries; for example, doctors are largely found only in the healthcare
industry. One of the survey’s products is that industries can be profiled with
their general mix of occupations. This is called an industry’s occupational
staffing pattern.
This brings
us back to the original questions: what occupations are in demand, what
occupations pay well and have lucrative outlooks, and ultimately, what
occupation(s) should I build my career upon?
The
foundation is to make informed forecasts about how industries will
expand/contract over the next 10 years. By applying existing occupational
staffing patterns to each industry’s projected change, a trained economic
analyst can then make an extrapolation about how occupations will
correspondingly increase/decrease. Knowledgeable analyst judgment further
refines the occupational expectations, such as knowing an occupation will grow
faster than in the past, with the result being a set of occupational projections
that accumulate to profile a state or regional economy.
A new set of
occupational projections are done every two years to keep the information fresh
even though economies do not change dramatically in short order. Because of
slow change, updated occupational projects generally continue the overall
message of preceding occupational projections. But economies do modify with
time, and therefore, subtle changes will arise with each new set of
occupational projections.
Utah’s most
recent occupational projections are found here: http://www.jobs.utah.gov/wi/pubs/outlooks/state/index.html.
These projections look forward to the year 2024.
The
occupational profile is structured from the general to the detailed, mimicking
the structure of a family tree. First, broad occupational categories are
defined, such as management or healthcare occupations; then, subcategories are
defined; and finally, individual occupations are defined. Individual occupations
are the heart of the occupational projections. But overall patterns and
characteristics do emerge when observing the broader categories.
While a Utah
statewide profile leads the way, Utah’s local economies are not homogenous;
therefore, nine Utah subregions are also profiled. Due to confidentiality
restraints and statistical reliability, the amount of occupations available
will diminish the smaller a subregion; but, occupations comprising the backbone
of a regional economy will be available.
Wednesday, April 20, 2016
Your area’s labor market information is “OnTheMap”
The Census Bureau’s online mapping tool provides a wealth of
location-specific labor market information
“If you want to put yourself on the map,
publish your own map.” Ashleigh Brilliant
This isn’t your same old blog
post about data. Instead of analyzing and sharing data, this post covers how to
access an extremely useful “big data” labor market information tool. What is
this tool? The U.S. Census Bureau’s OnTheMap web-based mapping and reporting
application.
What’s so great about
OnTheMap? Typically, we report labor market information at the state and county
level. Local-level data is harder to come by. Along with the ability to provide
labor market profiles of small and large nonstandard areas, OnTheMap
graphically demonstrates where people work and where workers live. Users can
define their own geographies and obtain data and maps at the census-block level
of detail. This flexibility can quickly provide information for emergency and
transportation planning, site location and economic development.
- Do you want to understand commuting patterns for a particular area? OnTheMap can generate maps of outflow and inflow.
- Do you want to know the basic characteristics of workers in your town? OnTheMap has that information.
- Do you want to identify the employment characteristics along a specific stretch of highway? OnTheMap can deliver that data.
- Do you want to discern how many workers live within a 50-mile radius of a particular site? OnTheMap delivers.
Where does this data come
from? OnTheMap combines federal and state administrative data on workers and
employees with Census Bureau census and survey data. Don’t worry. Using
state-of-the-art methods, the Census Bureau is committed to protecting the
confidentiality of business and personal information.
Where People Work
Let’s run through a few
examples of how OnTheMap outputs can help you understand your local economy. Suppose
the Kaysville City Council wants to know where the residents of their town
work. OnTheMap indicates almost a quarter of the city’s working residents are
employed in Salt Lake City.


Next, the mayor wants to know
how many workers travel into Kaysville for employment. OnTheMap suggests that
far fewer workers commute in than out of Kaysville. In-commuters are most
likely to drive from Layton.


Labor Market Characteristics
Now, these local government
officials have decided they would like to know the characteristics of those
folks that work or live in Kaysville. OnTheMap can provide age-group, earnings,
industry, race/ethnicity, gender and educational attainment information. For
example, OnTheMap shows the following characteristics for working residents of Kaysville:
- One-fourth are 29 years or younger
- 48 percent make more than $3,333 a month
- 8 percent work in manufacturing
- 382 are Hispanic or Latino
- 26 percent have at least a Bachelor’s degree
- 43 percent are female
Getting Specific
A company thinking of
locating to Kaysville is interested in the number (and characteristics) of
workers within a standard commuting distance of a particular worksite. Economic
development professionals can specify a particular radius and obtain a report.
Other shapes (donut and plume) are also available. In addition, users can draw
their own polygons in OnTheMap. To determine how many workers may be
inconvenienced by a road construction project, just draw a line along the
length of the project and “buffer” the selection.


You begin to see what a
valuable informational tool OnTheMap can be for planning and economic
development purposes.
OnTheMap is available here: http://onthemap.ces.census.gov/
Subscribe to:
Posts (Atom)