Showing posts with label Region--Wasatch Front North. Show all posts

Wednesday, June 3, 2020

Unemployment Insurance Claims Data Shed Light on the Local Economic Impacts of the COVID-19 Pandemic


Unemployment Insurance Claims Data Shed Light on the Local Economic Impacts of the COVID-19 Pandemic

By Lecia Parks Langston, Senior Economist; Michael Jeanfreau, Regional Economist

“You have power over your mind — not outside events. Realize this, and you will find strength.” Marcus Aurelius

In the wake of the COVID-19 pandemic, businesses lost revenues and workers lost jobs. But because of the time it takes to collect and collate data, economists have been left without much information to quantify the economic impacts at the local level.

But there is one ray of data illumination. Claims for unemployment benefits are promptly available and provide information about a large cross section of the economy. This post will outline what light unemployment claims data sheds on the state of Utah’s Wasatch Front North economy.

While not all workers are protected by unemployment insurance laws, roughly 95% of jobs are covered. This makes claims data an exceptional source of information about the economy. Not included under unemployment insurance laws are most self-employed workers, about half of agricultural employment, unpaid family workers, railroad personnel (covered separately) and many nonprofit organizations (such as churches). Also, some out-of-work employees may not have worked a sufficient work history to qualify for unemployment insurance benefits, but may file anyway. Fortunately, in this time of economic distress, the social safety nets of the unemployment insurance program, special national COVID-19 funding and social programs are working together to keep workers’ income and well-being stable.

Unemployment claimants and the unemployed; they aren’t the same

Also, keep in mind that, in addition to individuals drawing unemployment benefits, the unemployment rate includes those entering and re-entering the workforce and noncovered groups without current employment. This means the number of “unemployed” will be greater than the number of claimants. In “normal” times, only about 40% of the “unemployed” are claiming benefits. The generally reported unemployment rate also has a work-search requirement. If you haven’t made any minimal attempts to find work, you aren’t counted as “unemployed.”

Watch this Space

While this analysis won’t be updated on a regular basis, new data will be added to the data visualization on a weekly basis allowing readers to check back for the latest information.

An Unprecedented Event

Not surprisingly, first-time claims for unemployment benefits have soared in Utah and across the nation as the pandemic swept across the country. This increase is unprecedented since the creation of unemployment insurance coverage during the Great Depression. Week 12 (beginning March 16) marks the start of this unparalleled surge in claims. On a positive note, while new claims for unemployment benefits have skyrocketed in Utah, the state currently shows one of the lowest claims rates in the nation.

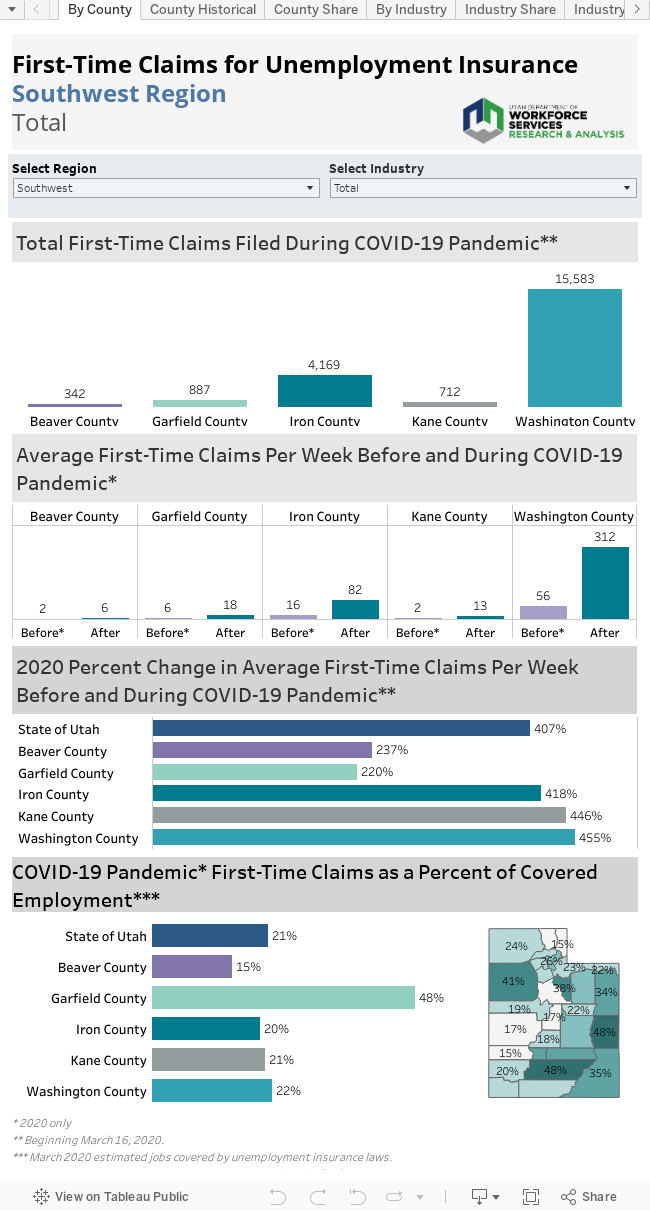
For most Wasatch Front North counties, initial claims peaked in week 14 (starting March 30) and have since tapered downward. During the peak, initial claims filed totaled 5,744 in the region. By week 19, claims measured considerably lower but continued to run substantially greater than in previous years — even during the “Great Recession.”

Here’s another example of the tremendous flood of new claims. Prior to the COVID-19 pandemic, counties in Wasatch Front North Utah averaged a total of 240 first-time claims per week. This time period included seasonally high claims weeks in January. In the weeks after, an average of 3,342 claims were filed for a staggering increase of 1,392%.

Who took the hardest hit?

Each county in the Wasatch Front North region has had a different industry leading the total number of claims in the area. Overall, manufacturing lead total initial claims at 13%, followed by both health care/social assistance and retail trade at 12%, with food service/accommodation following at 11%. Additionally, claims from unknown industries are also prevalent, representing 12% of total initial claims. These claims will mostly fall into the food service industry.

The Domino Effect of COVID-19

In the early stages of the pandemic, this was a story of service-dependent industries. However, the domino effect of the COVID-19 pandemic have also begun to have large impacts in other industries. Claims have been distributed fairly evenly among different industries, with manufacturing, health care/social assistance, retail trade, accommodation/foodservice and claims from “unknown” industries as the top five industries impacted within each county in the Wasatch Front North region. Many of these unclassified claims would rightfully be counted among accommodations/food services if the appropriate information were available.

The initial impact of the pandemic led to the closure of face-to-face jobs, but the change in employment and social behavior both locally and abroad has led to subsequent closures in other industries. Industries that didn’t face instructions to alter behavior during this event still had to adapt to the difference in consumer behavior, supply chains and additional safety precautions.

The Industry Flow

Initial claims in the region have come in waves, with food service/accommodation and unknown claims peaking in week 12, followed by an uptick in claims from nonessential health care services and retail trade through weeks 13 and 14, and lastly a marked increase in manufacturing by week 15.

The High and the Low

Although the largest numbers of claims in Wasatch Front North have come from manufacturing, health care/social assistance, retail trade and food services, in percentage terms, other industries have actually suffered more. For example, in the smaller industries of mining, real estate/rental and leasing, information and personal care services have all seen similar losses of between 16-19% of total covered employment.

Because of its job-to-job nature, the construction industry typically accounts for 15-25% of first-time claims. However, although construction’s new claims have also increased, they have increased at a much slower-than-average rate. After the COVID-19 pandemic hit, construction contributed less than 4% of all first-time claims. Ease of social-distancing and good weather have helped construction maintain employment levels. New claims measured just 5% of covered construction employment.

Only a portion of agricultural employment is covered by unemployment insurance laws. However, as companies work to keep America fed, agribusiness has laid off few employees. Only 2% of Wasatch Front North’s covered agricultural workers have filed a claim during the COVID-19 pandemic.


Public administration, educational services (including public and higher education), finance/insurance and utilities have also managed to keep a higher percentage of their workforces employed.


County by County

Davis County
  • Davis County matched the state average for new claims as a share of covered employment (10%). While the whole region suffered similar initial losses, Davis County was largely spared the increase in manufacturing claims that Weber County experienced in the weeks following the arrival of the COVID-19 pandemic.
  • While the percent of covered employment is lower in Davis County, it had the largest total initial claims in the region (13,951), narrowly beating out Weber County (12,451).
  • Prior to the COVID-19 pandemic, Davis County averaged 104 first-time claims per week compared with 1,744 claims after the pandemic. This increase of 1,581% ranked as the largest in the region.
  • Retail trade, health care/social services and accommodation/food services generated the highest number of initial claims during the pandemic.
  • Davis County’s initial claims peaked on week 14, totaling 3,081. This was the only week that claims rose over 3,000.
  • The regional share of new claims that Davis County had rose from before 43% of claims to 52% during the pandemic.

Morgan County
  • Prior to the COVID-19 slowdown, Morgan County averaged three unemployment insurance claims per week compared to 42 new claims afterward, an increase of 1,071%.
  • Because of its relatively large share of service industry employment, Morgan County has shown a higher-than-average increase in claims due to the COVID-19 pandemic.
  • New claims as a percent of covered employment measured at 13% — above the state average of 10%.
  • Morgan was slightly unusual compared to other areas, with health care/social assistance receiving more initial claims than food service/accommodation industry.
  • In counties with small workforces, the lack of data accuracy can make an impact to volatility. In Morgan County, the initial claims data show claims from an overwhelming percentage of covered employment in both entertainment and management of companies.
  • Morgan County remained a meager 1% of total first-time claims for the region during the COVID-19 pandemic.


Weber County
  • While Weber County and Davis County are the two large contributors to employment numbers in the region, Weber County has had 12,451 total first-time claims filed during the COVID-19 pandemic. While this is only slightly less than Davis County (13,951), Weber County’s share of first-time claims within the entire region dropped before and during the COVID-19 slowdown from 55% of all claims before to 47% of all claims during. This means that, while Weber County’s claims increased proportionately less than other counties in the region.
  • Before the slowdown, an average of 133 initial claims were being filed in Weber County compared to an average of 994 claims in the following weeks. The pre-to-post-pandemic increase registered at 1,339%
  •  Initial claims for unemployment insurance filed during the pandemic as a percent of covered employment measured at 11%, near the middle of a ranking of all Utah counties.
  • Weber County had more first-time claims filed during the pandemic from the manufacturing (2,376) and health care/social assistance (1,470) industries than the more common accommodation/food services.
  • While the total claims are higher in other industries, several industries suffered larger portions of claims as a percent of covered employment. Real estate/rental and leasing saw claims from 19% of covered employment, while industries designated as “other services” received the same. In this case, these claims will largely be coming from personal beauty services, a subset of “other services.” Information (18%), mining (16%) and accommodation/food service (16%) all similarly saw claims from a high percent of covered employment.
  • Claims originating from manufacturing and transportation surged towards the latter weeks of the pandemic time period.


Monday, January 29, 2018

Ten Year Later:
Differing patterns of recession and recovery in the Wasatch Front North

December 2017 marked 10 years since the Great Recession first cast its long shadow across the American economy. The recession officially lasted 18 months, but its consequences can still be seen across the country without having to look very hard. We have not had another recession since.
Utah was hit hard at the time, losing a larger share of jobs than the national average; but, we were fortunate to be one of the most resilient states in terms of economic rebound. There are plenty of states where the Great Recession continues to weigh upon them. Employment levels in 14 states are still not back to their pre-recession peak, and another 29 states have only grown 5.0 percent or less. As the working-age population has grown by more than 5.0 percent, the job gains nationally have not been enough to fully employ working-age labor.

Utah lost 7.0 percent employment during the recession. Since that low, employment has recovered by 18 percent. That is the second best rebound in the nation. From Utah’s pre-recession employment peak to now, Utah’s employment has increased by 9.5 percent, third best in the nation. Yet, Utah’s job growth has not been enough to absorb all of the labor force growth during that time. Utah’s unemployment rate is low, but the percent of the working-age population in the labor force is several percentage points below the pre-recession norm — telling us that potential labor is still not as fully engaged with the job market as before the recession.

As a whole, Utah has had a notable recession rebound, but those gains have not been shared equally across all regions. Just like the national profile, some areas have bounced back strong while others are still lagging behind. The state’s metropolitan areas have grown well, but many of Utah’s rural areas cannot say the same. Nine counties have employment levels below their pre-recession peaks.

In this issue of Local Insights, we profile Utah’s regional and county economies in light of the 10-year span since the Great Recession.

Wasatch Front North

The Wasatch Front North (Davis, Morgan and Weber counties) is often viewed as a single region. The reality is they each have distinct economies and experienced differing recessionary impacts and recoveries. For instance, Davis County is tied closely to Hill Air Force Base (AFB) and U.S. defense spending. This helps to stabilize the region. Morgan County is a growing bedroom community, but most new construction halted during the recession. Weber County has a vibrant and diversifying economy, but lacks a significant recession-resilient core to soften the severity of economic downturns.

Davis County

Davis County experienced a mild contraction during the recession in comparison to Utah’s other counties, losing only 4,000 jobs and falling by 3.6 percent. The downturn was short-lived, too. Davis County started expanding again at the beginning of 2010, and regained its pre-recession employment by late 2011; a time when most other counties were just turning the corner and starting to rebound.

There is no single sector that dominates Davis County’s economy, but Hill Air Force Base functions as the primary engine for economic growth and stability — accounting for about 10 percent of total county employment (around 12,000 civilian employees). During recessions demand falls for many nonessential goods and services, but government defense spending is historically stable. During the recession, Hill AFB employment dipped slightly for a few quarters and then picked up helping to prop up the local economy.

Defense contracts bring steady jobs and the people filling those jobs bring their families to live in the area. This adds to health care services and education demand. Both provide recession-resilient jobs. The health and education sectors combined continued to grow during the recession, and have provided the single most consistent employment growth since the recession’s end — adding more than 8,000 new jobs to Davis County since 2007.

Retail trade is the next largest industry in Davis County. In most local economies retail growth follows the lead of other “core” industries, primarily serving the local population demand. Due to its location along a major commuting artery and its targeted growth strategies, Davis County has developed a retail industry that serves a significant number of consumers from outside the county that brings money into the local economy. Retail trade employment is typically sensitive to economic downturns, but in Davis County it only dipped slightly and then came back strong — averaging more than 3.0 percent growth since 2011, and even adding additional retail space in areas such as Station Park in Farmington.

Thanks to its diversity and recession-resilient core, the Davis County recovery has been steady and shared across many sectors. Current employment now sits at about 124,000 — nearly 25 percent higher than its pre-recession count. Growth at Hill AFB and the related IT, engineering and manufacturing jobs it spawns boosts the local economy’s vibrancy. Professional, technical and scientific services have been expanding employment at a rate of about 4.7 percent annually on average since 2010, adding relatively high paying jobs that will only help to further stabilize the region in the next cyclical downturn.

Weber County

At the beginning of 2008, Weber County’s employment was nearly 97,000. By 2011 that number had dropped to around 90,000 — a more than 7.0 percent decrease. Drawdowns of both goods and service industries contributed to the decline. Auto parts and aerospace manufacturing jobs dropped sharply with large layoffs at Autoliv and Williams International, among others. Business and employment services jobs sagged as well, especially among telemarketing establishments and temporary work agencies. The construction sector shed some 3,000 jobs over the time period — in both residential and non-residential construction. Nearly every sector was affected negatively, except for education and health care services, which tend to be relatively resilient to economic downturns.

Weber County’s recession resilient industries are not quite large enough to act as a buoy when the rest of the economy is struggling. The IRS is the county’s single largest employer, and those federal jobs tend to be stable even through recessions. But it still only accounts for about 6.0 percent of total employment. Weber State University is a major stabilizing employer in the region, as well — as are the local hospitals (McKay Dee and Ogden Regional). Education and medical care tend to be recession hardy, but even those employers combined still only make up about 7.0 percent of county total employment. Their share of the economy was not large enough to absorb other large job losses and counteract the fall in overall consumer demand. Granted, without these stabilizing industries the recession might have been much worse for Weber County.

The recession hit Weber County hard, but it did not stay down long. By early 2011, the economy was on the upswing and has grown at an average annual rate of about 3.0 percent since. The pre-recession employment peak of 97,000 was regained by 2014, and now the county sits at about 105,000. The rebound has been driven by some of the previously prominent industries as well as some new players. For example, auto parts manufacturing has added back all the jobs lost during the recession plus 500 more (largely at Autoliv). Pharmaceutical manufacturing (primarily Fresenius in Ogden) has doubled its share of county total employment since 2008, adding more than 600 jobs over that time. In addition, business support and temp work agencies have returned to pre-recession levels. But the really interesting county newcomer is non-store retailing. Prior to the recession online retailers were virtually nonexistent in Weber County — but the arrival of Wayfair in 2011 changed that. There are now nearly 1,000 jobs in the industry.

The rise of these new industries suggests that Weber County’s economy is further diversifying — a valuable element to help protect against future industry-specific downturns. But diversity is not the only factor that mitigates recessionary impacts. Large recession-resilient employers (like the IRS) act as stabilizers, but the IRS has been downsizing (more than 1,000 jobs since 2011) which will reduce Weber County’s recession-resilient core.

Morgan County

Morgan County lost about 300 jobs — or roughly 15 percent of its 2008 employment during the last recession. Pre-recession peak employment was nearly 2,000, and by 2012 that had dropped to almost 1,700. Construction was hardest hit, shedding upwards of 180 jobs and accounting for the majority of job losses. Morgan County has a large and growing share of residents that commute outside the county for work. New residents moving in were driving strong residential construction demand prior to the recession — 105 new residential units were permitted in 2007. Once the housing crisis hit, demand plummeted. In 2009, only 20 units were permitted.

Most other industries were relatively insulated from the recession. Browning, a sporting equipment manufacturer and wholesaler, and the largest employer in the region, was able to hold employment steady. Holcim, a concrete manufacture and the second largest employer, did the same. These core industries’ stability helped to mitigate constructions job-loss effects as local demand remained consistent and health care, education and retail all weathered the storm relatively well.

Morgan County turned the corner at the end of 2012, and has been growing at an average annual rate of 5.0 percent since. New growth in health care and retail are driving the recovery. New single-family home construction is on the rise but has yet to return to pre-recession levels. By 2015 the county had recovered to its pre-recession peak and is now sitting at more than 2,200 jobs.

Wednesday, April 20, 2016

Your area’s labor market information is “OnTheMap”


The Census Bureau’s online mapping tool provides a wealth of location-specific labor market information

“If you want to put yourself on the map, publish your own map.” Ashleigh Brilliant

This isn’t your same old blog post about data. Instead of analyzing and sharing data, this post covers how to access an extremely useful “big data” labor market information tool. What is this tool? The U.S. Census Bureau’s OnTheMap web-based mapping and reporting application.  

What’s so great about OnTheMap? Typically, we report labor market information at the state and county level. Local-level data is harder to come by. Along with the ability to provide labor market profiles of small and large nonstandard areas, OnTheMap graphically demonstrates where people work and where workers live. Users can define their own geographies and obtain data and maps at the census-block level of detail. This flexibility can quickly provide information for emergency and transportation planning, site location and economic development. 
  • Do you want to understand commuting patterns for a particular area? OnTheMap can generate maps of outflow and inflow. 
  • Do you want to know the basic characteristics of workers in your town? OnTheMap has that information. 
  • Do you want to identify the employment characteristics along a specific stretch of highway? OnTheMap can deliver that data. 
  • Do you want to discern how many workers live within a 50-mile radius of a particular site? OnTheMap delivers.
Where does this data come from? OnTheMap combines federal and state administrative data on workers and employees with Census Bureau census and survey data. Don’t worry. Using state-of-the-art methods, the Census Bureau is committed to protecting the confidentiality of business and personal information. 

Where People Work     

Let’s run through a few examples of how OnTheMap outputs can help you understand your local economy. Suppose the Kaysville City Council wants to know where the residents of their town work. OnTheMap indicates almost a quarter of the city’s working residents are employed in Salt Lake City. 


Next, the mayor wants to know how many workers travel into Kaysville for employment. OnTheMap suggests that far fewer workers commute in than out of Kaysville. In-commuters are most likely to drive from Layton.


Labor Market Characteristics

Now, these local government officials have decided they would like to know the characteristics of those folks that work or live in Kaysville. OnTheMap can provide age-group, earnings, industry, race/ethnicity, gender and educational attainment information. For example, OnTheMap shows the following characteristics for working residents of Kaysville:
  •  One-fourth are 29 years or younger
  •  48 percent make more than $3,333 a month
  •  8 percent work in manufacturing
  •  382 are Hispanic or Latino
  •  26 percent have at least a Bachelor’s degree
  • 43 percent are female
Getting Specific

A company thinking of locating to Kaysville is interested in the number (and characteristics) of workers within a standard commuting distance of a particular worksite. Economic development professionals can specify a particular radius and obtain a report. Other shapes (donut and plume) are also available. In addition, users can draw their own polygons in OnTheMap. To determine how many workers may be inconvenienced by a road construction project, just draw a line along the length of the project and “buffer” the selection.


You begin to see what a valuable informational tool OnTheMap can be for planning and economic development purposes. 

OnTheMap is available here: http://onthemap.ces.census.gov/