Showing posts with label Economist--Lecia Langston. Show all posts

Wednesday, June 3, 2020

Unemployment Insurance Claims Data Shed Light on the Local Economic Impacts of the COVID-19 Pandemic


Unemployment Insurance Claims Data Shed Light on the Local Economic Impacts of the COVID-19 Pandemic

By Lecia Parks Langston, Senior Economist; Michael Jeanfreau, Regional Economist

“You have power over your mind — not outside events. Realize this, and you will find strength.” Marcus Aurelius

In the wake of the COVID-19 pandemic, businesses lost revenues and workers lost jobs. But because of the time it takes to collect and collate data, economists have been left without much information to quantify the economic impacts at the local level.

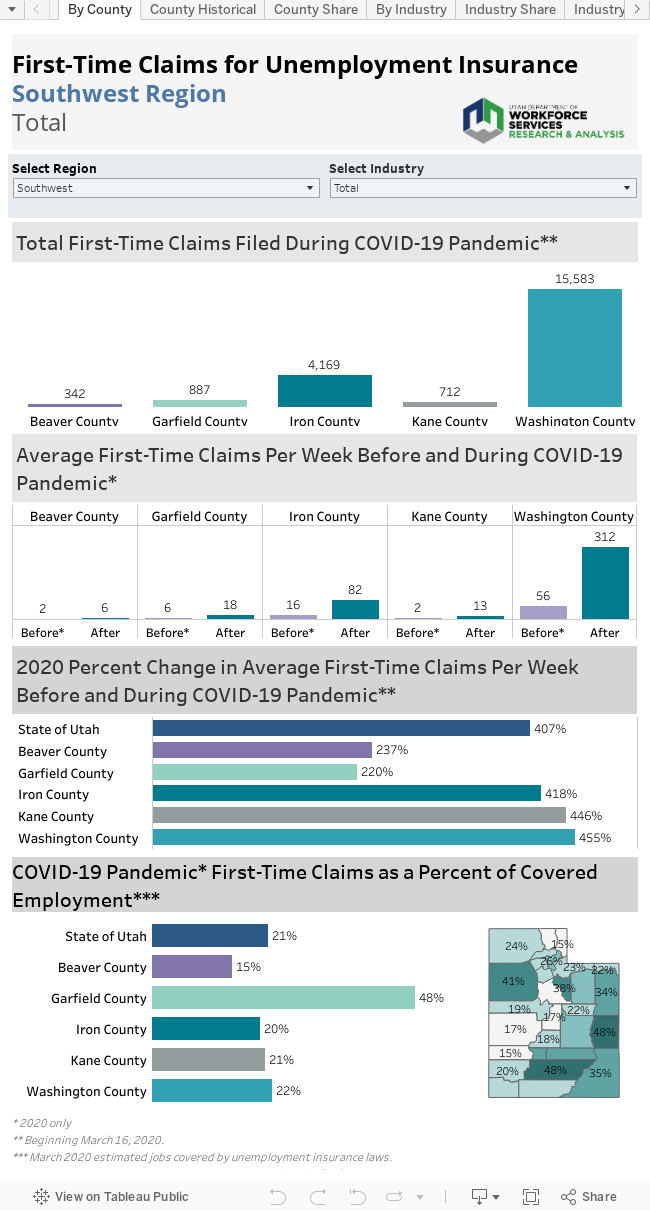
But there is one ray of data illumination. Claims for unemployment benefits are promptly available and provide information about a large cross section of the economy. This post will outline what light unemployment claims data sheds on the state of Utah’s Wasatch Front North economy.

While not all workers are protected by unemployment insurance laws, roughly 95% of jobs are covered. This makes claims data an exceptional source of information about the economy. Not included under unemployment insurance laws are most self-employed workers, about half of agricultural employment, unpaid family workers, railroad personnel (covered separately) and many nonprofit organizations (such as churches). Also, some out-of-work employees may not have worked a sufficient work history to qualify for unemployment insurance benefits, but may file anyway. Fortunately, in this time of economic distress, the social safety nets of the unemployment insurance program, special national COVID-19 funding and social programs are working together to keep workers’ income and well-being stable.

Unemployment claimants and the unemployed; they aren’t the same

Also, keep in mind that, in addition to individuals drawing unemployment benefits, the unemployment rate includes those entering and re-entering the workforce and noncovered groups without current employment. This means the number of “unemployed” will be greater than the number of claimants. In “normal” times, only about 40% of the “unemployed” are claiming benefits. The generally reported unemployment rate also has a work-search requirement. If you haven’t made any minimal attempts to find work, you aren’t counted as “unemployed.”

Watch this Space

While this analysis won’t be updated on a regular basis, new data will be added to the data visualization on a weekly basis allowing readers to check back for the latest information.

An Unprecedented Event

Not surprisingly, first-time claims for unemployment benefits have soared in Utah and across the nation as the pandemic swept across the country. This increase is unprecedented since the creation of unemployment insurance coverage during the Great Depression. Week 12 (beginning March 16) marks the start of this unparalleled surge in claims. On a positive note, while new claims for unemployment benefits have skyrocketed in Utah, the state currently shows one of the lowest claims rates in the nation.

For most Wasatch Front North counties, initial claims peaked in week 14 (starting March 30) and have since tapered downward. During the peak, initial claims filed totaled 5,744 in the region. By week 19, claims measured considerably lower but continued to run substantially greater than in previous years — even during the “Great Recession.”

Here’s another example of the tremendous flood of new claims. Prior to the COVID-19 pandemic, counties in Wasatch Front North Utah averaged a total of 240 first-time claims per week. This time period included seasonally high claims weeks in January. In the weeks after, an average of 3,342 claims were filed for a staggering increase of 1,392%.

Who took the hardest hit?

Each county in the Wasatch Front North region has had a different industry leading the total number of claims in the area. Overall, manufacturing lead total initial claims at 13%, followed by both health care/social assistance and retail trade at 12%, with food service/accommodation following at 11%. Additionally, claims from unknown industries are also prevalent, representing 12% of total initial claims. These claims will mostly fall into the food service industry.

The Domino Effect of COVID-19

In the early stages of the pandemic, this was a story of service-dependent industries. However, the domino effect of the COVID-19 pandemic have also begun to have large impacts in other industries. Claims have been distributed fairly evenly among different industries, with manufacturing, health care/social assistance, retail trade, accommodation/foodservice and claims from “unknown” industries as the top five industries impacted within each county in the Wasatch Front North region. Many of these unclassified claims would rightfully be counted among accommodations/food services if the appropriate information were available.

The initial impact of the pandemic led to the closure of face-to-face jobs, but the change in employment and social behavior both locally and abroad has led to subsequent closures in other industries. Industries that didn’t face instructions to alter behavior during this event still had to adapt to the difference in consumer behavior, supply chains and additional safety precautions.

The Industry Flow

Initial claims in the region have come in waves, with food service/accommodation and unknown claims peaking in week 12, followed by an uptick in claims from nonessential health care services and retail trade through weeks 13 and 14, and lastly a marked increase in manufacturing by week 15.

The High and the Low

Although the largest numbers of claims in Wasatch Front North have come from manufacturing, health care/social assistance, retail trade and food services, in percentage terms, other industries have actually suffered more. For example, in the smaller industries of mining, real estate/rental and leasing, information and personal care services have all seen similar losses of between 16-19% of total covered employment.

Because of its job-to-job nature, the construction industry typically accounts for 15-25% of first-time claims. However, although construction’s new claims have also increased, they have increased at a much slower-than-average rate. After the COVID-19 pandemic hit, construction contributed less than 4% of all first-time claims. Ease of social-distancing and good weather have helped construction maintain employment levels. New claims measured just 5% of covered construction employment.

Only a portion of agricultural employment is covered by unemployment insurance laws. However, as companies work to keep America fed, agribusiness has laid off few employees. Only 2% of Wasatch Front North’s covered agricultural workers have filed a claim during the COVID-19 pandemic.


Public administration, educational services (including public and higher education), finance/insurance and utilities have also managed to keep a higher percentage of their workforces employed.


County by County

Davis County
  • Davis County matched the state average for new claims as a share of covered employment (10%). While the whole region suffered similar initial losses, Davis County was largely spared the increase in manufacturing claims that Weber County experienced in the weeks following the arrival of the COVID-19 pandemic.
  • While the percent of covered employment is lower in Davis County, it had the largest total initial claims in the region (13,951), narrowly beating out Weber County (12,451).
  • Prior to the COVID-19 pandemic, Davis County averaged 104 first-time claims per week compared with 1,744 claims after the pandemic. This increase of 1,581% ranked as the largest in the region.
  • Retail trade, health care/social services and accommodation/food services generated the highest number of initial claims during the pandemic.
  • Davis County’s initial claims peaked on week 14, totaling 3,081. This was the only week that claims rose over 3,000.
  • The regional share of new claims that Davis County had rose from before 43% of claims to 52% during the pandemic.

Morgan County
  • Prior to the COVID-19 slowdown, Morgan County averaged three unemployment insurance claims per week compared to 42 new claims afterward, an increase of 1,071%.
  • Because of its relatively large share of service industry employment, Morgan County has shown a higher-than-average increase in claims due to the COVID-19 pandemic.
  • New claims as a percent of covered employment measured at 13% — above the state average of 10%.
  • Morgan was slightly unusual compared to other areas, with health care/social assistance receiving more initial claims than food service/accommodation industry.
  • In counties with small workforces, the lack of data accuracy can make an impact to volatility. In Morgan County, the initial claims data show claims from an overwhelming percentage of covered employment in both entertainment and management of companies.
  • Morgan County remained a meager 1% of total first-time claims for the region during the COVID-19 pandemic.


Weber County
  • While Weber County and Davis County are the two large contributors to employment numbers in the region, Weber County has had 12,451 total first-time claims filed during the COVID-19 pandemic. While this is only slightly less than Davis County (13,951), Weber County’s share of first-time claims within the entire region dropped before and during the COVID-19 slowdown from 55% of all claims before to 47% of all claims during. This means that, while Weber County’s claims increased proportionately less than other counties in the region.
  • Before the slowdown, an average of 133 initial claims were being filed in Weber County compared to an average of 994 claims in the following weeks. The pre-to-post-pandemic increase registered at 1,339%
  •  Initial claims for unemployment insurance filed during the pandemic as a percent of covered employment measured at 11%, near the middle of a ranking of all Utah counties.
  • Weber County had more first-time claims filed during the pandemic from the manufacturing (2,376) and health care/social assistance (1,470) industries than the more common accommodation/food services.
  • While the total claims are higher in other industries, several industries suffered larger portions of claims as a percent of covered employment. Real estate/rental and leasing saw claims from 19% of covered employment, while industries designated as “other services” received the same. In this case, these claims will largely be coming from personal beauty services, a subset of “other services.” Information (18%), mining (16%) and accommodation/food service (16%) all similarly saw claims from a high percent of covered employment.
  • Claims originating from manufacturing and transportation surged towards the latter weeks of the pandemic time period.


Friday, February 28, 2014

Wednesday, September 18, 2013

MSA Gross Domestic Product estimates released

The U.S. Bureau of Economic Analysis just released 2012 Gross Domestic Product (GDP) estimates for Metropolitan Statistical Areas (MSAs) in the United States. On average, MSA real GDP (adjusted for inflation) increased by 2.5 percent in 2012—slightly lower than the total U.S. average of 2.8 percent.

Nationally, Texas and Indiana dominated the rankings for the fastest-growing MSAs. Each of these states placed three MSAs among the top ten. The New Orleans and San Francisco MSAs showed the fastest-growing large MSA economies.

In Utah, only the Logan UT-ID MSA experienced below-average expansion (up only 1 percent. The Provo-Orem MSA produced the highest percent change—4.5 percent and ranked 32nd nationally. The St. George MSA recovered from GDP contraction in 2010 to show a healthy 3.2 percent gain in 2012. For more information about this data release, click here.

Monday, February 25, 2013

2011 Advance GDP by Metropolitan Area Released

The U.S. Bureau of Economic Analysis recently released gross domestic product estimates for the nation’s 366 metropolitan areas. In 2011, metropolitan area growth registered an average of 1.6 percent—just slightly higher than the U.S. total (1.5 percent). However, the growth rate for metro areas dropped noticeably from the 2010 expansion of 3.1 percent.

Only 242 of the nation’s metropolitan areas experienced a 2011 gain in GDP. However, all of Utah’s metro area’s showed increases equal to or greater than the U.S. metro average. Both Ogden/Clearfield and Provo/Orem generated gains of greater than 5 percent. Lowest on the scale proved the Logan metro area with a gain of only 1.6 percent. For more information on the current release, click here.

Monday, March 12, 2012

Foreclosure Rates

I've had a couple of questions lately about where to find foreclosure rates by county. Without paying for information, county-level foreclosure rates are hard to find and when you can find them, the numbers are old (HUD foreclosure rates, 2008; New York Federal Reserve Bank, Third Quarter 2010). Some private entities (such as Realty Trac) publish limited free foreclosure information. However, they don't publish their methodology and an analysis of their figures suggest they may leave something to be desired.

However, for Metropolitan Statistical Areas (MSAs), I have found what looks to be some decent free and relatively up-to-date foreclosure data. This analysis of LPS Applied Analytics Data by the Local Initiatives Support Corporation (LISC) is well documented and on-going. And, their methodology is available so the data-user can understand the data itself. You can access their data by clicking here.

I've also thrown together some visualizations of their foreclosure data below. First some definitions:

Foreclosure Rate: Percent of all mortgages in the foreclosure inventory in the reference month.  Mortgages in the foreclosure inventory include those in foreclosure and bankruptcy foreclosures prior to auction or trustee sale.

Prime Foreclosure Rate: Percent of all prime mortgages in the foreclosure inventory in the reference month.  Prime mortgages are those that are Grade A, not a government product or government-insured, and either with 1) credit scores over 720 or 2) credit scores are from 680-719 with full documentation.

Subprime Foreclosure Rate: Percent of all subprime mortgages in the foreclosure inventory in the reference month. Subprime mortgages are those that a servicer coded as subprime or loans made to borrowers with FICO scores below 620 who did not receive a government, Fannie Mae or Freddie Mac loan.

Serious Delinquency Rate: Percent of all mortgages either 90 or more days delinquent or in the foreclosure inventory in the reference month.

90+ Delinquency Rate: Percent of all mortgages 90 or more days delinquent and have not yet entered into judicial or non-judicial foreclosure in the reference month.

Not surprisingly, Utah's poster child for the housing bubble, the St. George, UT MSA (Washington County), shows the rates for most worst measures. On the other hand, it still ranks far below some of the worst MSAs (many in Florida and also nearby Las Vegas). In June 2011, Washington County's foreclosure rate ranking measured 146 and its serious delinquency rate measured 130. The Salt Lake City MSA showed the next Utah highest rankings, while the Logan, UT-ID MSA showed the lowest foreclosure rankings. Hmmm. . .Utah MSAs with the most bubble-like increases in home prices (see the previous post) also show the highest foreclosure rates. While the MSA in Utah with the smallest home-price acceleration during the boom (Logan, UT-ID MSA) shows the lowest foreclosure ranking in Utah. Coincidence? I think not.

You'll also notice that all the Utah MSAs show a decline in serious delinquency rates since the national peak in foreclosures in December 2009. In this case, the St. George, UT MSA has shown the most improvement.


Tuesday, September 13, 2011

Most of Utah's Metropolitan Statistical Areas experience GDP growth in 2010

The U.S. Bureau of Economic Analysis just released annual Gross Domestic Product (GDP) estimates for Metropolitan Statistical Areas (MSAs) today. Remember that GDP represents the value of all goods and services produced in an area. Real (inflation-adjusted) U.S. GDP for metropolitan area increased an average 2.5 percent in 2010 after declining 2.5 percent in 2009. Growth proved widespread with real  GDP increasing in 304 of 366 (83 percent) metropolitan areas, led by national growth in durable-goods manufacturing, trade, and financial activities.

In Utah, growth also dominated the figures with only the St. George, UT MSA displaying an annual decline in real GDP (down 1.6 percent). In general, GDP growth in Utah's MSAs registered below average. The Logan UT, MSA showed the most rapid expansion (4.0 percent).

For more information about the 2010 GDP figures for MSAs, click here.

Wednesday, February 23, 2011

Metropolitan GDP figures released


The U.S. Bureau of Economic Analysis (BEA) has just released 2009 estimates of Gross Domestic Product for Metropolitan Statistical Areas (MSAs) across the nation. (Yes, that's not a "typo" 2009 data is the most recent information available for MSAs.) Given the economic downturn, it may be surprising that only 80 percent (292 of 366) of the nation's MSAs experienced a decline in real (inflation-adjusted) gross domestic product.

How did Utah's MSAs perform? Three of five Utah MSAs showed an increase in gross domestic product in 2009--Logan, Salt Lake City, and Ogden-Clearfield. In fact, the Salt Lake City MSA (which includes Salt Lake, Tooele, and Summit counties) placed in the top quintile of all MSAs. The gains weren't phenomenal (just under 1 percent), but during a recession, any gains are certainly welcome.

The St. George, UT MSA (Washington County) produced the worst Utah decline in GDP during 2009--3.4 percent. Of course, the St. George area participated in housing market speculation to a much greater degree than any other area in the state. Indeed, Washington County's decrease placed it in the lowest quintile of all MSAs. It's performance ranking? It ranked 310 out of 366 MSAs. In addition, Provo-Orem experienced a 1.7 percent drop.

For more information on recent GDP performance: http://www.bea.gov/newsreleases/regional/gdp_metro/gdp_metro_newsrelease.htm

Home prices hit post-bust lows in most big cities

Home prices in a majority of major U.S. cities tracked by a private trade group have fallen to their lowest levels since the housing bubble burst. The Standard & Poor’s/Case-Shiller index fell in December from November in all but one of the 20 cities it tracks. The 20-city index declined 1 percent.
The only market to see a gain was Washington, D.C. Along Utah’s Wasatch Front, according to a Jan. 27 report, the residential real estate market, mired in one of the worst downturns ever, is showing a few signs of improvement.
In Salt Lake County, 1,934 existing single-family homes were sold in the fourth quarter of 2010, down 21 percent compared with the fourth quarter of 2009, according to the Salt Lake Board of Realtors. The median selling price was $215,000, down 4.4 percent from the same three-month period in 2009 and off a peak of $256,000 in the summer of 2007. Salt Lake Tribune
Note: The Federal Housing Finance Agency also publishes the Housing Price Index for all Metropolitan Statistical Areas (MSAs). The following chart shows the year-to-year change in the index for Utah MSAs. The most current index is for third quarter 2010. A bottom to housing prices according to this chart would occur when the year-to-year is equal to zero. At this point, the Logan, UT MSA is closest to a bottoming in prices, followed by the Ogden-Clearfield MSA. Not surprisingly, these two areas experienced the lowest level of speculation in the housing market. You can access this information at: http://www.fhfa.gov/Default.aspx?Page=14

Wednesday, December 22, 2010

9 Utah solar energy projects receive Blue Sky money

Rocky Mountain Power's Blue Sky program is helping fund the construction of nine community-based renewable energy projects in the state. Overall, more than $938,000 was awarded for 12 projects in Utah, Wyoming and Idaho, including 11 solar projects and one wind project. The funding is made possible through participating Blue Sky customers, who number more than 34,000. Deseret News

Tuesday, September 28, 2010

Census Bureau Releases American Community Survey data for 2009

The U.S Census Bureau has released the 2009 American Community Survey (ACS) 1-year estimates on American FactFinder. There you will find tables with social, demographic, housing, and economic data for areas with populations of 65,000 or more. The American Community Survey provides a wealth of demographic, social, economic and housing data. For example, here is where Utah ranks among all U.S. states and the District of Columbia in 2009.

Utah ranks:
  • Forty-ninth for the percent of households with one or more person 65 years or older.
  • Number one for the percent of households with one or more person under 18 years of age.
  • Fifty-first for the percentage of people with a disability.
  • Eighth for the percentage of people over 25 who have graduated from high school.
  • Twentieth for the percentage of people over 25 with at least a Bachelor's degree.
  • Thirty-fourth for the percent of married couples with both spouses in the labor force.
  • Forty-eighth for the percentage of children in poverty.
  • Twelfth for the percentage of children without health insurance coverage.
  • Twentieth for the percentage of the population without health insurance coverage.
  • Fifth for the percentage of homes built since 2005.
  • Twenty-first for median family income.
  • Twenty-second for the percentage of the population that is foreign born.
  • First for average household size.
  • Forty-ninth for the age of women at first marriage.
  • Forty-first for the average travel time to work.
  • Eighteenth for the percentage of the population that is white/not Hispanic.
  • Sixteenth for the divorce rate for women.

Data for 2009 are available for the state, Cache, Davis, Salt Lake, Utah, Washington, and Weber counties. Three-and five-year estimates will be available for the remaining counties in three to four month.

Click here to access the data.